Hello,
It's been a while since our last newsletter and we have quite a few updates to share, including:
- An update on the T3 Predictathon
- Updated AgriSeq genotyping protocols
- The addition of intercropping support to phenotyping trials
- Improvements to the summarize trial tools interface
Some T3 Predictathon Challenge Results!
The Predictathon challenged contestants to predict grain yield for genotyped wheat accessions across 9 US test trials, using T3/Wheat data with test-trial phenotypes withheld.
Contestants had to make CV0 predictions which allowed the use of previous evaluation of test-trial accessions (prediction of "old" accessions in a "new" environment) and CV00 predictions where test-trial accession phenotypes were all hidden (prediction of "new" accessions in a "new" environment). External data (e.g., weather) and AI coding assistance were permitted.
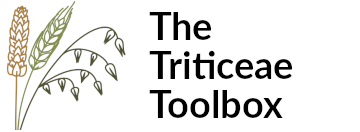
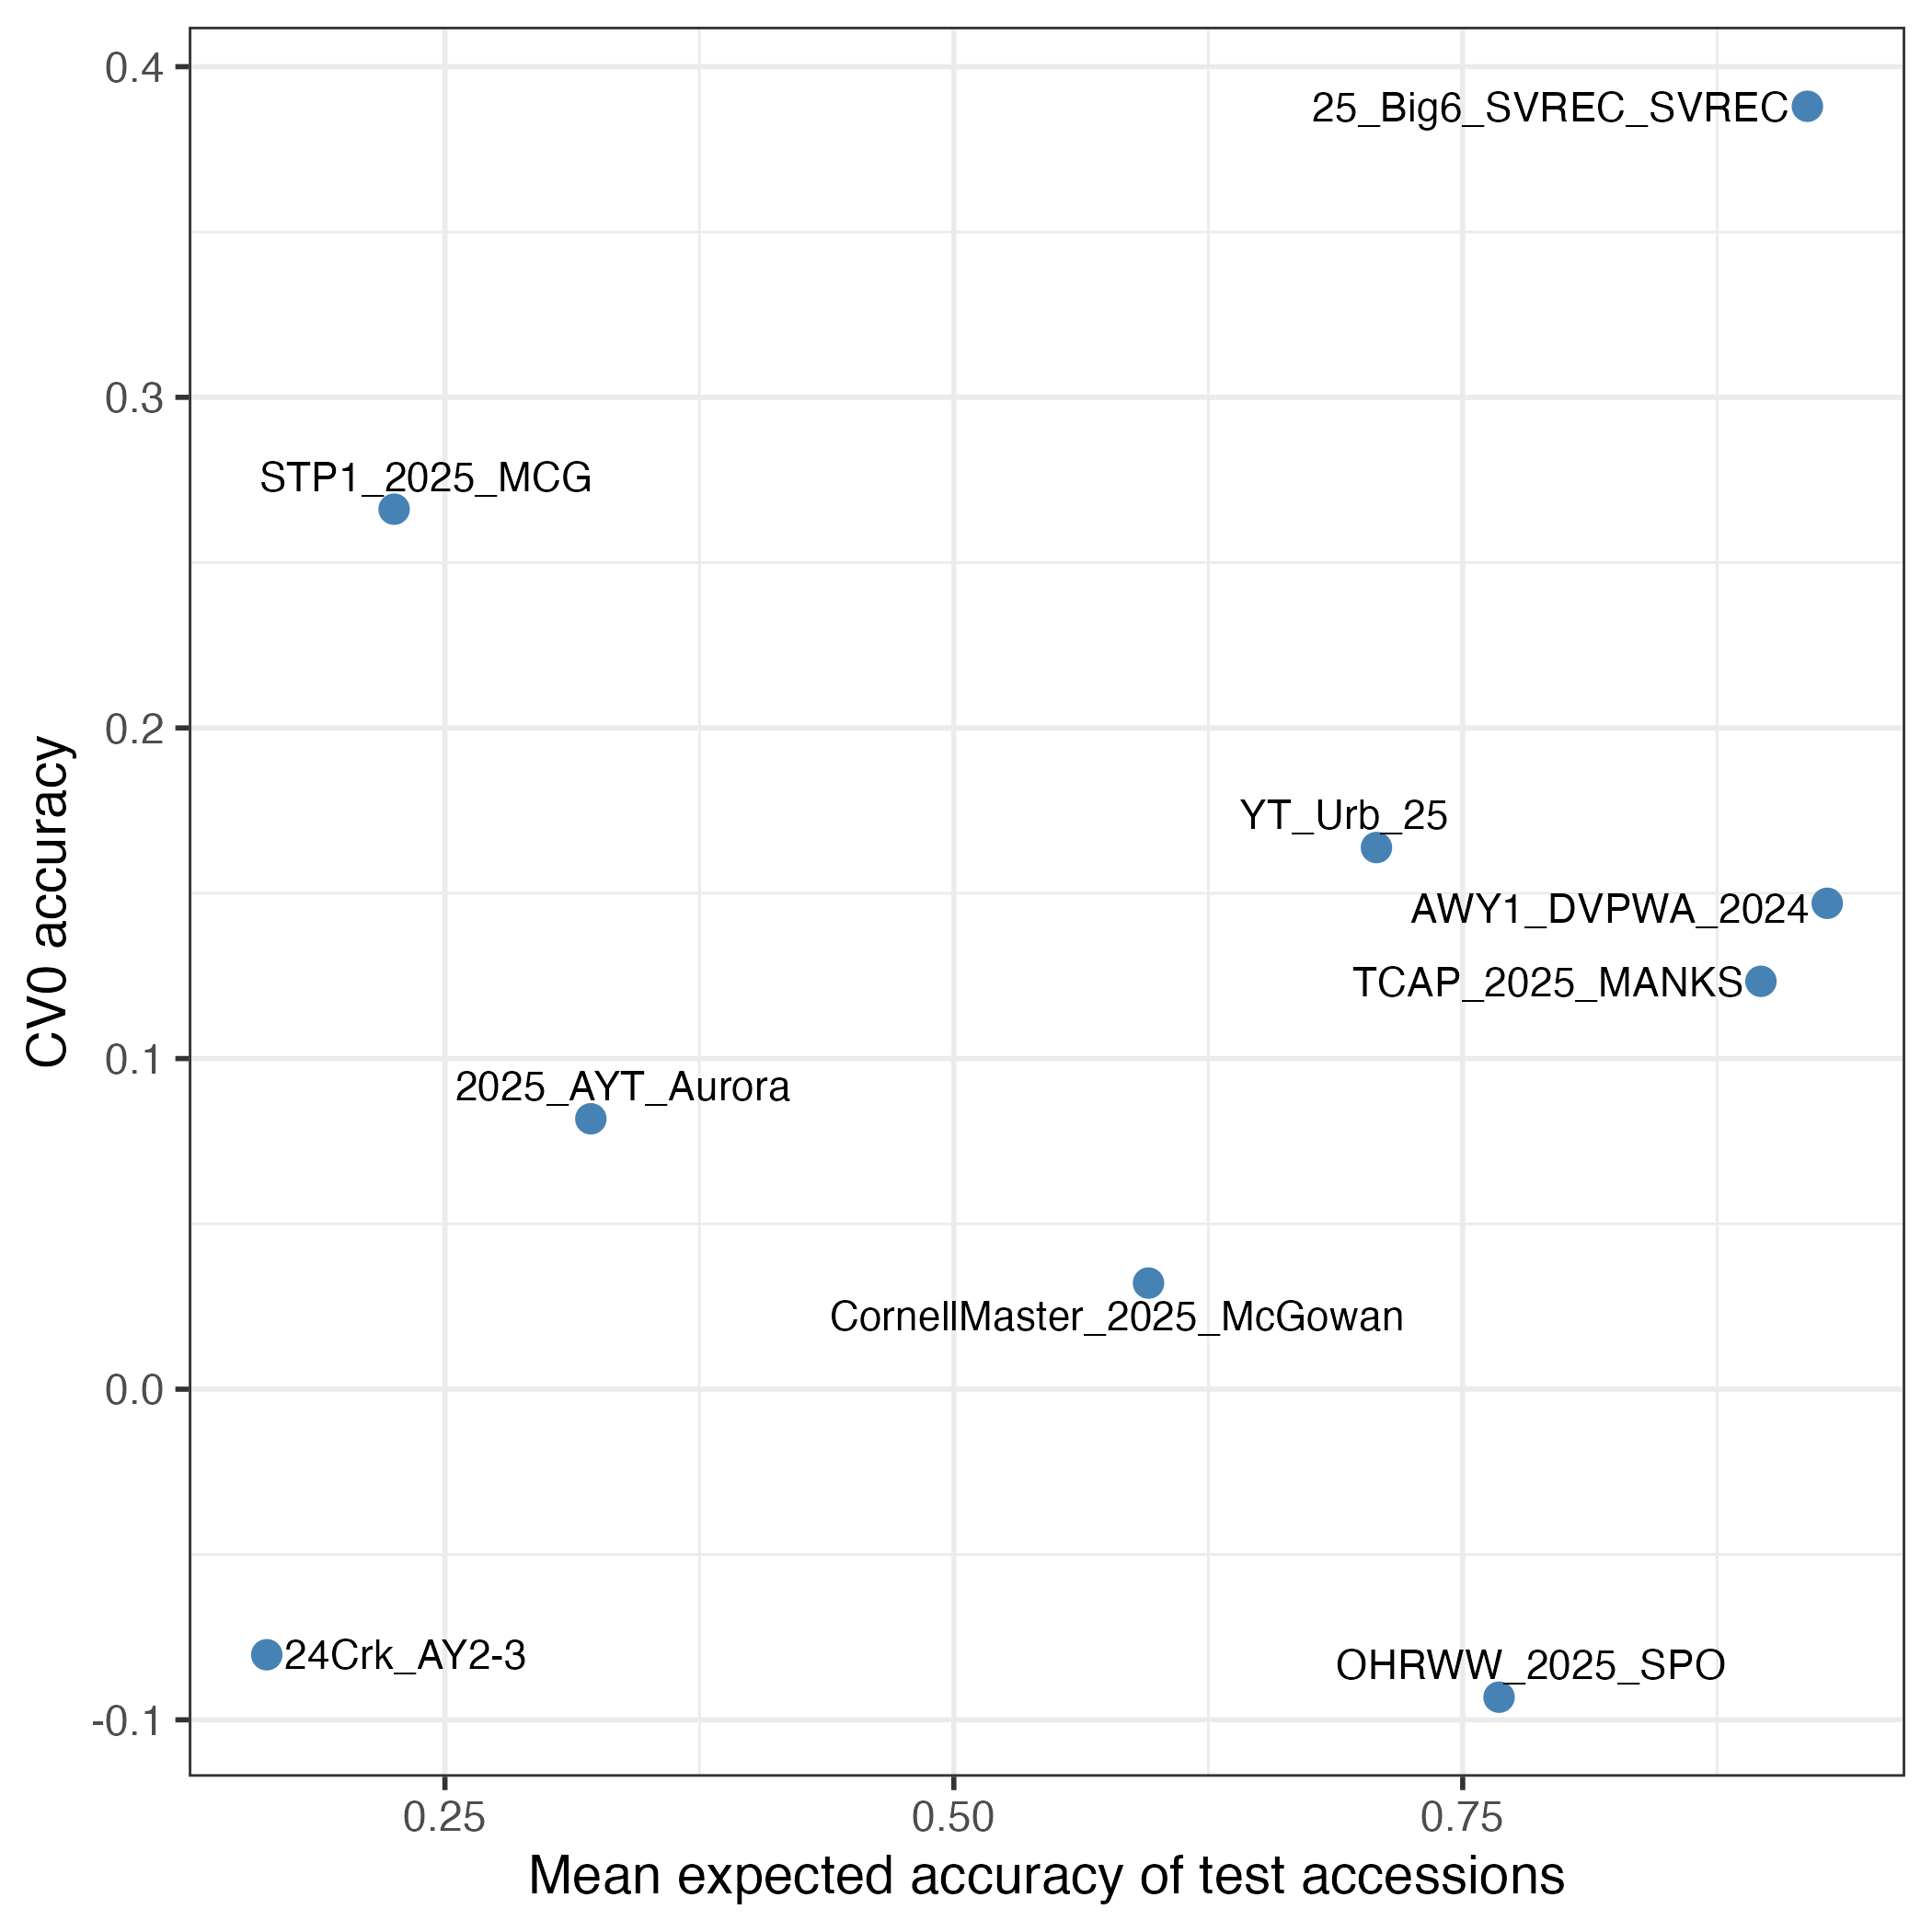
We received five submissions, three from the US, one from Germany and one from Taiwan. The prediction efforts were varied and well executed. We are writing a manuscript to describe these outcomes and the methods that were used to make predictions. In this newsletter note, I want to focus on the question of what allowed a specific trial to be well predicted (or not). Here are two figures that look at a theoretical construct "Mean expected accuracy (MEA) of the test accessions" and how well it predicts the empirical accuracy of the nine trials. The MEA takes into account:
- The closeness of the relationship between the accessions in the training set and the accessions in the test trial (close is better than distant)
- The number of accessions in the training set (more is better)
- Independence / lack of independence of the training accessions (independent is better: each training accession contributes unique prediction information)
- How well the training accessions have been evaluated (i.e., in how many trials are they present in T3).
So it's pretty comprehensive. But you can see it's far from perfect. The TAMU trial (STP1_2025_MCG) is a notable exception: it was well predicted despite having a sparse training set. Conversely, the Wisconsin trial (OHRWW_2025_SPO) was poorly predicted despite having a robust training set. Those exceptions notwithstanding, MEA holds up reasonably well and highlights breeding programs that have deep data for prediction (Michigan: 25_Big6_SVREC; Illinois: YT_Urb_25; and ARS-KS: TCAP_2025_MANKS) [Note to everyone: these are good examples to follow!]. Interestingly, the Washington trial (AWY1_DVPWA_2024) is strongly predicted under CV0 but poorly under CV00: many of the accessions in that trial had been previously evaluated (good for CV0) but not many close relatives (bad for CV00).
A couple things MEA can't account for:
- How the training set is assembled. You can only calculate MEA once you have put your training trials together. Different prediction algorithms put them together in different ways and so would have different MEA values for each trial.
- GxE: MEA assumes that you are predicting the same trait that has been measured in previous trials. If GxE is strong, then the trait measured in the test trial is different from what has been measured before and prediction accuracy decays as the genetic correlation between performance in the new environment and in the old environment decays.
Indeed, you can clearly see that observed accuracy was always substantially lower than the expected accuracy. GxE is one cause for that. A separate major cause is that we are predicting test trial additive genetic (breeding) values but we are correlating them against test trial phenotypes as our best empirical measurement of that breeding value. Obviously, the phenotype has both experimental error and non-additive genetic effects in it that cause it to deviate from the additive genetic value prediction.
Genome-wide marker platforms augmented with custom markers: Updated AgriSeq Protocols
Genotyping accomplishes two things:
- Obtaining estimates of relatedness to other germplasm through genome-wide markers
- Identifying alleles present at major loci using Known Informative Markers (KIMs).
The Small Grains Genotyping Labs (SGGLs) work hard to include KIMs in the genome-wide marker platforms that they work with. Usually there are some KIMs that need to be genotyped separately with customer markers (often KASP assays). We're pleased to announce that the Triticeae Toolbox (T3) can now append custom markers to existing genotype protocols. This makes it easier to keep protocols current as new markers become available — without having to create new genotyping protocols. Thus, we are reducing the proliferation of new protocols.
To demonstrate this feature, the AgriSeq 4K and 5K protocols have been updated to include the Sst1 KASP marker, which tracks the solid stem trait (resistance to wheat stem sawfly). The updated protocols are available now on T3/WheatCAP:
- AgriSeq 4K plus KIMs
- AgriSeq 5K plus KIMs
We encourage breeders to take advantage of this new capability by working with the SGGLs and T3 to submit additional KASP markers for inclusion in future protocol updates.
Intercropping Support
We've been slowly working on adding intercropping support to T3 for phenotyping trials. Our initial use-case is to store a set of oat and pea intercropping trials in T3/Oat and these changes can be applied to other intercropping systems across T3 and breedbase in general. The main requirements for this support include:
- Storing accession records for multiple species
- Allowing a plot in a trial to contain more than one accession
- Supporting multiple trait ontologies (one for each crop)
Storing accession records for multiple species has already been possible on T3. Each accession record is required to have the species name set and is linked to the corresponding organism in the database and the database allows accessions linked to different organisms. The one caveat is that accession names have to be unique across all species. For example, if there is already an oat accession named "Dawn" then you cannot add a new pea accession also named "Dawn". For T3, we'll handle this by adding the crop name to the accession name if there is a duplicate: "Dawn" for the oat accession and "Dawn (pea)" for the pea accession.
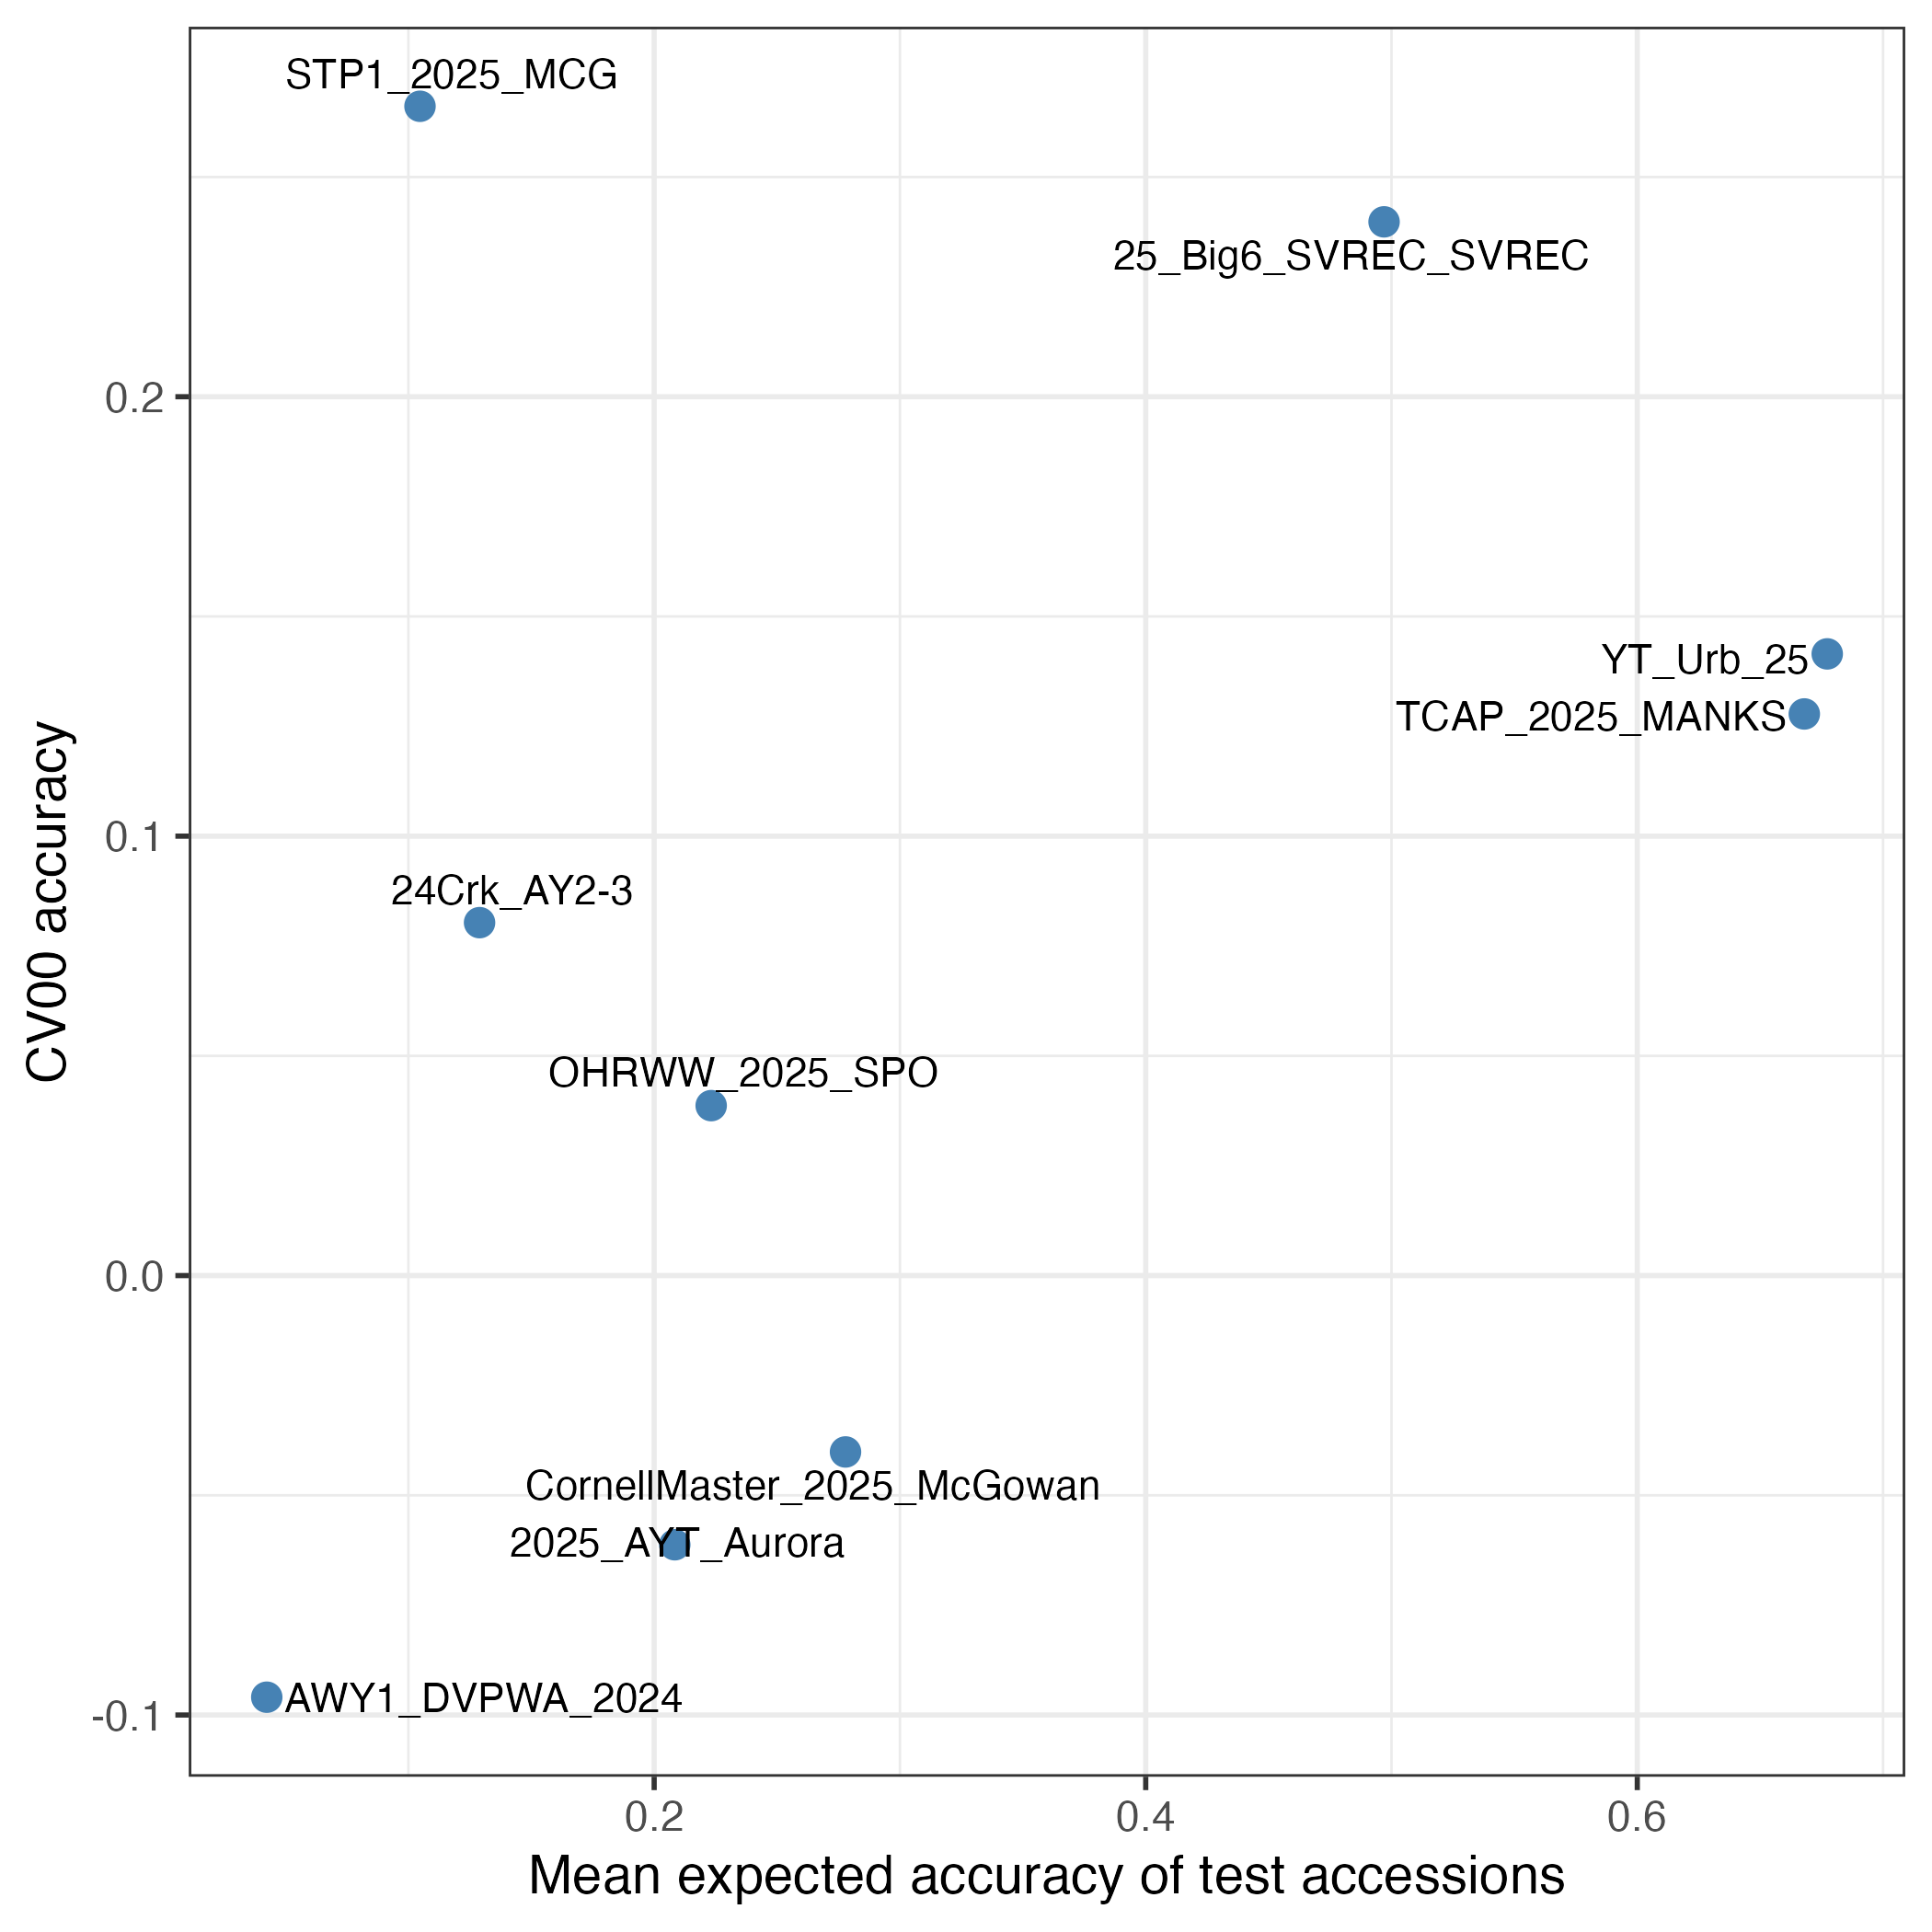
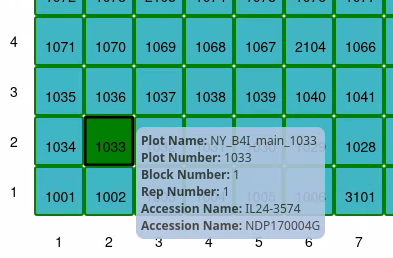
The biggest change we've had to make for supporting intercropping is allowing the database to store more than one accession per plot. The breedbase database structure was initially designed to just store one accession per plot and you can now add one or more additional intercropped accessions to a plot. Creating an intercropping trial is currently supported through the trial template upload and not the interactive trial design tool on the website. The trial upload template now has an "intercrop_accession_name" column where you can add one or more accession names to add additional accessions to a plot. The additional intercropped accessions are displayed on the trial detail page (experiment design section and the trial layout) and are included in all of the trait downloads.
The last change allows T3 to load multiple trait ontologies into the database. This allows us to keep the ontologies separate for each crop (making it easier to keep the ontologies in sync with the official crop ontology) and makes it clear which crop the trait is measuring. The additional ontologies are used exactly the same as the original ontology, they'll just have different CO_xxx prefixes to indicate the different species.
Please reach out to us if you're interested in adding intercropping trials to T3. We're still working on expanding the integration of the intercropping support into additional tools and features on the website and welcome any feedback. You can find more detailed information in the intercropping section of the breedbase manual.
Trial Summary Tool Improvements
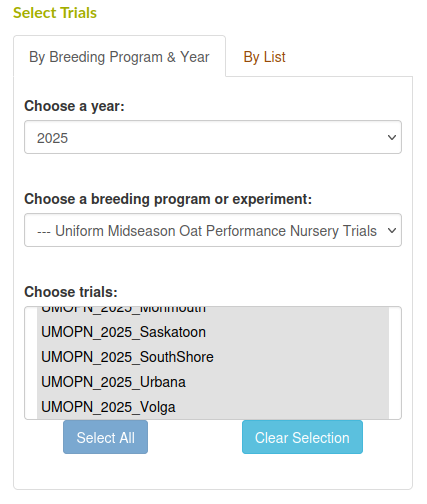
The interface for the trial summary tool (available from the homepage and under the Analyze menu > Summarize Trials option on any page) provides a quick summary of a set of trials by calculating the LS Means across locations and traits. Originally, in order to use the tool you would first need to create a list of the trials you are interested in. Now, you can use the tool directly by selecting a year and a breeding program (or folder / experiment of trials within a breeding program).
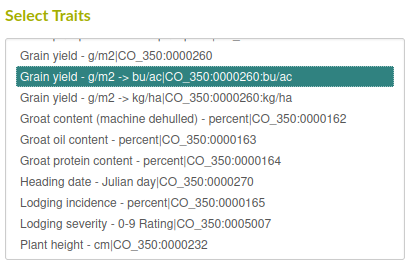
In addition, some of the more commonly used traits now have automatic trait conversions. For example, T3/Oat stores grain yield in g/m2, but if you'd rather get the data in bu/ac, you can now select your preferred units and T3 will convert the data automatically.
As always, feel free to test out any of these new features and give us any feedback! The quickest way to get in touch with us is the Contact Us button at the top of any page on the T3 websites.
- The Triticeae Toolbox
